
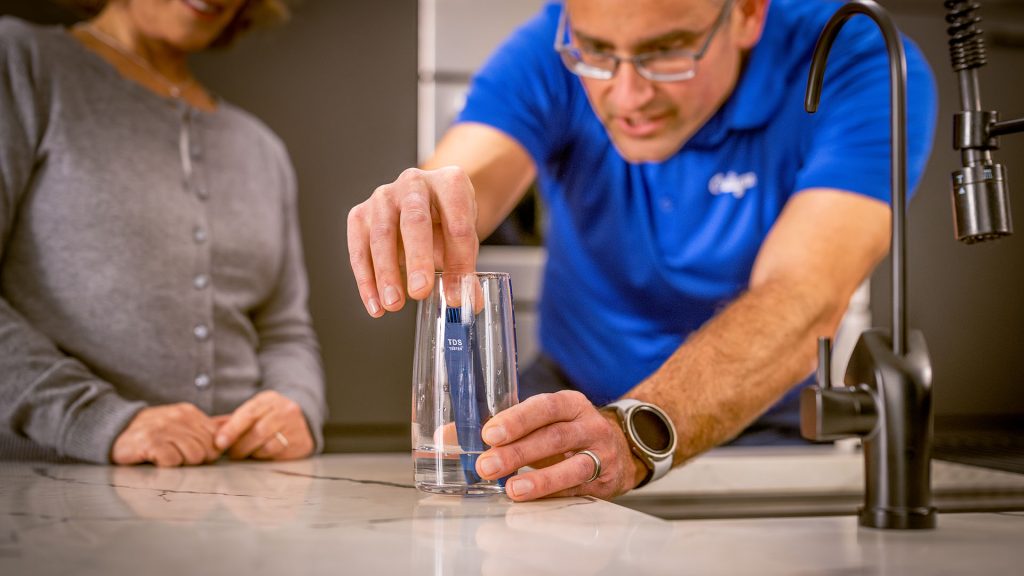
So, you took the proactive step to protect your property and health. You ordered a certified collection kit, carefully filled your sample bottles from the tap, and sent them off to a scientific facility. A few days later, a multi-page document arrives in your inbox.
You open the file, expecting a simple “pass or fail” grade, but instead, you are greeted by a dense grid filled with scientific shorthand, chemical symbols, decimal points, and specialized units of measurement like mg/L or ppb.
For most homeowners and business managers, looking at an environmental data sheet can feel like trying to read a foreign language. However, deciphering these results doesn’t require a degree in chemistry. Once you understand how the data is structured and what the key safety benchmarks mean, your report becomes a highly clear, actionable roadmap for your property’s water security. This step-by-step guide breaks down exactly how to interpret your results and translate the raw science into total peace of mind.
Anatomy of a Laboratory Report: The Core Columns
While every certified facility has its own proprietary layout, almost all official environmental documents are organized into a standardized grid. When you first open your document, bypass the layout fluff and look for these five critical pillars:
[ Your Water Report Grid ]
 ┌───────────────┬──────────────┬──────────────┬──────────────┬──────────────┐
 │   Parameter   │  Your Result │    Units     │   MCL/SMCL   │  Analysis ID │
 ├───────────────┼──────────────┼──────────────┼──────────────┼──────────────┤
 │  Lead (Pb)    │    0.002     │     mg/L     │    0.015     │   ICP-MS-04  │
 └───────────────┴──────────────┴──────────────┴──────────────┴──────────────┘
1. Parameter (The Target)
This column lists the specific chemical element, microbiological organism, or physical attribute that the lab searched for. You will typically see familiar words like “Lead,” “Nitrate,” or “Hardness,” often accompanied by their scientific or periodic table shorthand (such as Pb for lead or NO3 for nitrate).
2. Your Result (The Discovery)
This is the most important number on the sheet for your immediate needs. It represents the exact concentration of that specific parameter discovered inside the water sample you collected. If a substance was not found, or if it was present in an amount so incredibly small that even advanced machinery could not detect it, this column will read ND (Non-Detect) or show a less-than sign (e.g., <0.001).
3. Units of Measurement (The Scale)
To understand the weight of your result, you must know how it was counted. Environmental testing relies on highly microscopic metrics:
- mg/L (Milligrams per Liter): This is the standard metric used for major minerals and chemicals. In the water industry, one milligram per liter is exactly equivalent to one part per million (ppm). To visualize this, one ppm is like adding a single rolling pin of sugar into an entire railroad tanker car of water.
- µg/L (Micrograms per Liter): This scale is used for highly toxic trace elements. One microgram per liter is equivalent to one part per billion (ppb). One ppb is incredibly small—comparable to locating a single specific second in a span of 32 years.
- MPN or CFU per 100mL: Used exclusively in microbiological testing to denote the “Most Probable Number” or “Colony Forming Units” of bacteria alive within a 100-milliliter sample.
4. The Regulatory Benchmarks (MCL and SMCL)
This column provides the context that tells you whether your water is safe. These limits are derived from strict national testing standards established by environmental protection agencies to preserve public health.
- MCL (Maximum Contaminant Level): This is a legally enforceable safety ceiling. If your result is higher than the listed MCL, the water poses a direct health risk.
- SMCL (Secondary Maximum Contaminant Level): These are non-enforceable guidelines covering aesthetic or cosmetic issues. If your water crosses an SMCL, it isn’t necessarily dangerous to drink, but it may taste strange, smell bad, leave rusty stains, or damage your household plumbing.
Evaluating Your Results by Target Category
To make your report easy to digest, standard laboratory services usually group parameters into three primary scientific families.
1. Microbiological Health (Acute Risks)
This section should always be reviewed first, as biological hazards cause acute, immediate illness.
[Microbiological Results Check]
       │
       ├─► Total Coliform = Present/Positive ──► Physical breach; system needs repair
       └─► E. coli = Present/Positive ────────► Fecal contamination; DO NOT DRINK
When checking your bacteria lines, you are looking for a simple binary result: Absent or Present (sometimes written as Negative or Positive). If your report notes that Total Coliform is Present, your system has a physical vulnerability that is allowing topsoil, insects, or surface runoff to enter the supply. If E. coli is listed as Present, it confirms direct contamination from human or animal waste. You must stop drinking the water immediately and initiate system chlorination.
2. Inorganic and Heavy Metals (Chronic Risks)
This section lists heavy metals that dissolve into groundwater or leach directly out of old plumbing. A complete, itemized index of these elements can be explored by reviewing our master list of contaminants analyzed during standard laboratory processing.
- Lead: The environmental safety ceiling for lead is 0.015 mg/L (15 ppb). However, health agencies like the Environmental Protection Agency (EPA) maintain that there is no safe level of lead exposure for children. If your result shows any detectable number here, you should look for aging internal copper plumbing joined with vintage lead solder or legacy brass fixtures.
- Nitrates: The safety threshold sits firmly at 10 mg/L. If your private well report shows a value climbing toward this double-digit mark, agricultural fertilizers or a neighbor’s septic system are actively leaching into your underground aquifer.
3. General Chemistry and Aesthetic Balances
This data tells the story of how your water behaves mechanically inside your home.
- Hardness: Usually measured in mg/L or grains per gallon (gpg). If your total hardness value exceeds 120 mg/L, you have hard water. Over time, these dissolved calcium and magnesium minerals will form a rock-hard scale inside your water heater, choking your water pressure and destroying appliances years ahead of schedule.
- pH Level: This is a scale from 0 to 14 measuring water’s acidity. Your result should ideally land in the neutral zone between 6.5 and 8.5. A result below 6.5 means your water is highly acidic and corrosive. It will slowly eat away the interior walls of your copper pipes, leaving greenish-blue stains in your sinks and eventually creating hidden pinhole leaks inside your walls.
Navigating Local and Regional Anomaly Patterns
Because soil conditions, bedrock geology, municipal history, and regional industrial footprints vary dramatically from town to town, water chemistry is deeply regional. A property owner operating a well in a coastal plain might see high sodium and chloride levels, while a home nestled in a valley near historic manufacturing zones might show elevated trace metals or unique industrial elements.
If you look at your report and see an anomalous spike that doesn’t seem to match typical baselines, local geographic context is often the missing piece of the puzzle. Property owners can access targeted regional guidance by visiting our dedicated locations directory. This connects you directly with neighborhood environmental analysts who understand the unique municipal records, bedrock formations, and agricultural footprints specific to your exact town, county, or zip code.
Formulating Your Action Plan: What Comes Next?
Once you finish reading through your document line-by-line, your next steps depend entirely on what your numbers revealed:
| Data Scenario | Root Cause | Recommended Action |
|---|---|---|
| Bacteria or E. coli Present | Broken well cap, flooding, or system breach | Shock-chlorinate the well, find the structural leak, and re-test. |
| Lead or Copper Exceeds MCL | Corrosive water leaching metal from home pipes | Install an acid neutralizer to adjust pH, or replace legacy fixtures. |
| Nitrates Exceed 10 mg/L | Agricultural runoff or septic drainage | Install a specialized reverse osmosis system or an ion exchange unit. |
| Hardness Exceeds 120 mg/L | High dissolved calcium and magnesium | Calibrate and install a targeted water softener to protect infrastructure. |
If your report returns with every single parameter safely below the federal and state MCL targets, congratulations—your water is structurally secure, and you have a solid baseline to reference for future annual checkups.
The Value of an Independent Laboratory Partner
When a report reveals an elevated level of a certain contaminant, it can be tempting to panic or rush out to buy an expensive, uncalibrated filtration system from a door-to-door salesperson. This is why working with an independent, certified water testing laboratory is so vital.
Because a dedicated laboratory does not sell physical filtration equipment, softeners, or treatment systems, their scientists have zero financial incentive to exaggerate your risks or scare you into a purchase. You receive a completely unbiased, mathematically precise, and legally valid snapshot of your water quality.
Transforming Science into Safety
Reading a water test report doesn’t have to be overwhelming. By breaking the grid down into simple comparisons between Your Result and the MCL safety ceiling, you gain immediate clarity regarding the exact condition of your supply.
Taking a proactive, scientific approach to your water quality eliminates the anxiety of the unknown. Armed with an accurate laboratory report, you possess the exact chemical blueprint needed to make smart, targeted decisions—ensuring that every single drop of water keeping your family, employees, or property hydrated is perfectly pure, clean, and completely safe.